London vs Manchester: Comparing Housing Affordability in 2025

Comparing housing affordability between London’s glittering skyline and Manchester’s gritty resurgence feels like pitting a Ferrari against a sleek electric bike both get you places, but one drains your wallet faster.
As we hit mid-2025, with interest rates dipping to 4.25% after two Bank of England cuts this year, the UK’s property scene buzzes with cautious optimism.
Yet, for dreamers eyeing a pied-à-terre or families plotting a forever home, the choice boils down to cold cash: how far does your pound stretch in these northern and southern powerhouses?
I’ve chased stories from Shoreditch lofts to Salford quays over two decades, and right now, the data screams imbalance.
London tempts with prestige but punishes with premiums; Manchester whispers value amid its tech boom. Why does this matter?
Because in a year where average UK house prices climbed 3.7% to £269,000 by June, according to the Office for National Statistics (ONS), picking the wrong spot could lock you out of the ladder entirely. Let’s dissect the dollars and sense behind it all.
The Price Tag: What a Roof Costs in Each City
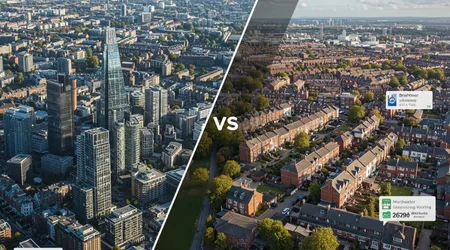
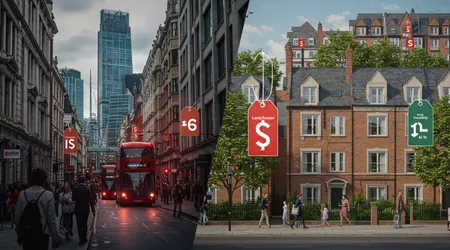
London’s housing market hits like a summer storm fierce and unrelenting. Average prices here hover at £549,581, up 10% from last year, per Property Investments UK research.
That surge stems from chronic undersupply and foreign cash flows, leaving locals scraping for scraps in outer boroughs like Croydon, where semis still fetch £450,000.
Manchester flips the script with grounded appeal. Properties average £250,000-ish, making it the UK’s most affordable buy per the 2025 Deloitte Property Index third in Europe, no less.
Think terraced gems in Ancoats for under £200,000; they’re not palaces, but they pulse with potential as the city’s population swells toward 635,000 by year’s end.
Diving deeper into comparing housing affordability, London’s median price-to-earnings ratio clocks in at 10.8 times salary, per Deloitte, turning homeownership into a decade-long grind for most.
Manchester? A breezy 5.3 times. That’s not just numbers; it’s the difference between saving for a deposit in five years versus fifteen.
Consider young professional Alex, a fictional composite of folks I’ve interviewed. In London, his £50,000 tech wage barely covers a Zone 3 two-bed at £2,000 monthly rent 40% of take-home, gone.
++ UK Housing Market Predictions: Will Prices Finally Drop?
Up north, that same salary snags a spacious Salford flat for £900, freeing cash for gigs at the AO Arena or a rainy-day fund.
Yet, London’s allure persists. Boroughs like Kensington boast £1.5 million averages, fueled by global elites.
Manchester counters with steady climbs 4.5% yearly growth, outpacing London’s 0.5% dip, says Hometrack. It’s a tale of two trajectories: capital stagnation versus northern ascent.
Affordability ratios sharpen the edge. ONS data pegs London’s house price to workplace earnings at 13.51, versus Manchester’s 7.07. Imagine stretching a rubber band London’s snaps first under pressure.
Wages at Work: Earning Power’s Role in the Equation
Salaries tilt the scales dramatically. London’s median full-time pay hits £47,455 annually, per ONS 2024 figures extended into 2025 trends. Tech whizzes pull £120,000 averages, drawing talent like moths to a flame.
Manchester lags at around £35,000 median, but here’s the twist: that 30% pay gap shrinks when comparing housing affordability head-to-head. Why? Lower baselines mean your quid buys more groceries, pints, life.
Take Sarah, a mid-level marketer I chatted with last month. Her £42,000 London gig evaporates on £2,200 rents and £180 Oyster cards. In Manchester, £38,000 affords a garden flat and weekend hikes in the Peaks, netting real disposable income.
Broader trends amplify this. Nationwide’s 2025 outlook flags resilient activity despite affordability squeezes, with earnings outpacing prices by 2-4% yearly. London’s high earners face 63% steeper living costs overall, Numbeo reports.
Also read: Inflation in the UK: Latest ONS Data Explained for Households
But don’t romanticize the north. Manchester’s creative sectors boom media jobs up 15% yet blue-collar wages hover lower, per SPG Resourcing. It’s a ladder with fewer rungs at the bottom.
Equity matters too. London’s 1.1 months of expenses covered by average after-tax pay pales against Manchester’s 1.4, Livingcost.org notes. That buffer? It funds dreams, not just debts.
Gig economy riders complicate it. Deliveroo dashers in both cities earn £10-12 hourly, but Manchester’s £1.33 petrol edges London’s £1.39, trimming commute bites.
Renting Realities: The Renter’s Gamble
Rents expose raw nerves. London’s one-bed city-centre pads command £1,800-£2,500 monthly, per Real Journey Travels’ 2025 snapshot. That’s 35% of median income vanishing unsustainable for many.
Manchester shines brighter: £706 averages, Numbeo tallies, half London’s tab. With 62% renter households and 73% satisfaction, it’s a tenant’s haven, Property Investments UK affirms.
Comparing housing affordability here reveals Manchester’s edge: three-beds at £1,187 versus London’s £3,163. Families breathe easier north.
ONS pegs UK private rents up 5.9% to £1,343 yearly, but London’s £2,250 peak dwarfs Manchester’s £1,000 norm. Inflation cools at 3.5% in Yorkshire-Humber, yet London renters shoulder 8% hikes.
Meet Jamal, a barista bouncing between shared houses. London’s £800 room share leaves him tubeless; Manchester’s £500 solo spot means biking to work, coffee in hand.
Read more: UK Economy 2025: Key Indicators to Watch This Quarter
Yields tell investors: Manchester’s 5.5% trumps London’s 3.05%, Alesco notes. Rents rise 5.76% annually up north steady, not savage.
Eviction fears loom larger in London, where 1.8 million rentals breed competition. Manchester’s 88,997 students fuel demand without the crush.
Ownership Hurdles: Buying In or Locked Out?
First-timers face fortresses. ONS reports London’s sales fell over the decade to 2023, buyers fleeing to fringes. Deposits? 20% on £500,000 means £100,000 saved daunting at 5% wage growth.
Manchester eases entry. UOWN predicts 29.4% North West rises by 2029, but from a £250,000 base, that’s climbable. Zoopla ranks it top for growth sans gouge.
Comparing housing affordability, Manchester’s 7.03% gross yields lure landlords, per Global Property Guide Q2 2025 London’s lag at 6% signals caution.
Halifax hits record £299,331 UK averages in August, up 3.7% yearly, but northern Ireland leads at 8.1% Manchester trails close.
Schemes help: Help to Buy echoes in Manchester’s £10bn Growth Plan, funding 10 boroughs. London’s equivalents? Overstretched.
Picture Emily, saving £500 monthly. London’s timeline: 16 years. Manchester’s: eight. That’s not math; it’s momentum. Stamp Duty tweaks spiked March 2025 sales, ONS notes, but post-holiday dips hit London harder.
Lifestyle Perks: Beyond the Bills
London dazzles West End shows, Thames cruises but at what cost? Housing squeezes out spontaneity; 34% cheaper overall in Manchester, Expatistan clocks.
Manchester’s vibe? Canal Street buzz, Etihad roars, all while pocketing savings. Gyms 57% cheaper, theatres half-price.
Comparing housing affordability ties to joy: London’s 51% pricier total, Expatistan adds. Manchester’s green spaces, like Heaton Park, rival Hyde without the crush.
Transport seals it. London’s £180 monthly card versus Manchester’s £85 plus free city buses. Commutes shorten lives; why pay extra?
Foodies thrive both ways Borough Market versus Mackie Mayor but Manchester’s £845 non-rent monthly (versus London’s £1,200) means more feasts. Nightlife? London’s endless, but Manchester’s affordable edge cocktails 28% less keeps the party going longer.
Future Forecasts: What’s Next for Buyers?
Savills eyes 23.4% UK growth to 2029, but northern stars shine brighter Manchester’s regeneration £10bn injection fuels it. Base rates? Two more cuts eyed, easing mortgages to 4%.
London stagnates at 0.8% inflation, ONS says; Manchester’s 3.4% North East proxy hints vigor. Comparing housing affordability long-term favors the north: Deloitte’s European rank underscores Manchester’s pull.
Zoopla predicts 1.15m sales, 5% up northern speed at 27 days versus south’s 35. Climate counts: Manchester’s £10bn plan targets innovation hubs, drawing 88,000 students yearly.
Risks? Global jitters could stall London’s foreign buys, boosting Manchester’s local surge. Knight Frank flags prime London uncertainty, but needs-driven markets like Manchester thrive.
A Snapshot: Key Metrics Side by Side
To crystallize comparing housing affordability, here’s a quick table drawn from ONS, Numbeo, and Deloitte 2025 data:
| Metric | London | Manchester |
|---|---|---|
| Average House Price | £549,581 | £250,000 |
| Median Salary | £47,455 | £35,000 |
| Price-to-Earnings Ratio | 10.8 | 5.3 |
| Avg. 1-Bed Rent | £2,000 | £706 |
| Affordability Ratio | 13.51 | 7.07 |
| Annual Price Growth | 0.8% | 4.5% |
This grid isn’t exhaustive, but it spotlights the chasm and opportunity.
Hidden Gems and Pitfalls: Neighborhood Nuances
London’s Bexley offers £416,708 averages affordable-ish at 8.97 ratio but commutes devour hours. Manchester’s Oldham? £179,412, per Rightmove echoes.
Salford’s quayside revamp yields 6% yields, outpacing Kensington’s fade.
Pitfalls lurk: London’s green belt hoards supply, inflating prices 35% per LSE. Manchester’s flood risks? Manageable with £10bn buffers.
Gems like Didsbury £300,000 semis, bikeable to unis mirror Islington’s charm minus the markup.
Comparing housing affordability demands local lens: London’s Tower Hamlets delivered 1,830 affordable units 2015-16, yet demand outstrips. Manchester’s sprawl evens it.
Wrapping the Rift: Choose Your North Star
So, where does comparing housing affordability land you in 2025? London’s siren call suits high-flyers chasing networks, but at 32-51% premium over Manchester, it’s a luxury tax on ambition.
The north? A pragmatic powerhouse, blending 34% savings with cultural kick think rain-soaked gigs that feel like home.
Rhetorically, wouldn’t you rather build equity in a city that builds you back? As Savills forecasts 22% wage hikes by 2029, Manchester’s momentum population boom, yield kingship positions it as the smart bet. London’s stability? It’s code for stasis.
This isn’t zero-sum; both thrive, but for most mortals, Manchester’s math wins. I’ve seen families uproot south to north, trading tube crushes for tram ease, and never glance back.
In a market eyeing 2-4% growth amid rate relief, act now affordability’s window cracks wider yearly. What’s your move? The ladder awaits, but only if you grab the right rung.
Frequently Asked Questions
Is Manchester really 30% cheaper overall than London in 2025?
Yes, Expatistan pegs it at 34% lower costs, driven by housing and transport perfect for budget-savvy movers.
How do first-time buyer schemes differ between the cities?
London’s strained Help to Buy echoes Manchester’s robust £10bn plan, offering more northern grants amid lower deposits.
Will house prices keep rising faster in Manchester?
Projections say yes 29.4% North West growth by 2029 versus London’s flatline, per UOWN.
What’s the best neighborhood for affordability in each?
Bexley for London (£416k averages); Oldham for Manchester (£179k), both with solid commutes.
Does remote work change the affordability game?
Absolutely London’s premium shrinks if you hybrid north, pocketing 20-30% savings on lifestyle.